Throughout my early career I struggled to understand where I fitted within the complex exploration and production industry. There were just so many specialist disciplines contributing to so many processes. It was bewildering.
Years later I realised that the work I did in those early years as a service provider included a lot of elements that the end-user probably didn’t need, and I also didn’t provide information that would have been really useful to the end-user.
I needed a “Big Picture”.
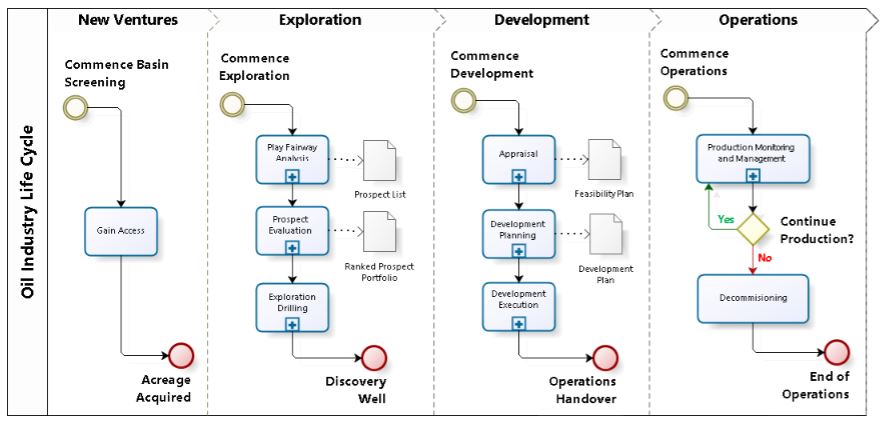
One way I have attempted to capture this is using Business process Mapping software. In this example I have used Bizagi, which is a free business modeller application that you can use to create shareable html models. Download it from Bizagi Modeller
The software allows you to create a navigable set of nested processes, from which you can link to all your online resources and help files. It is also possible to share the model and collaborate on it’s development.
This is very much a work in progress and was very much a “proof of concept”. I think it works. Does it have any value to anybody out there? Would anybody like to collaborate on this, in which case I might resurrect the shared version.
I think this could also be a neat way of showing where geoscientists fits within the wider world, if capture processes from all industries and organisations.
No Comments Yet